VSAN
VMware vSAN – Viewing Disk Capacity (RVC)
There are multiple ways to skin this cat, in this example I will show how to view % disk capacity utilization leveraging the Ruby vSphere Console (RVC). Begin by logging […]
Virtualization & Storage

There are multiple ways to skin this cat, in this example I will show how to view % disk capacity utilization leveraging the Ruby vSphere Console (RVC). Begin by logging […]
There are multiple ways to skin this cat, in this example I will show how to view % disk capacity utilization leveraging the Ruby vSphere Console (RVC).
Begin by logging into your vCenter Server over SSH and login to RVC by typing the following cmd:
rvc administrator@vsphere.local@localhost
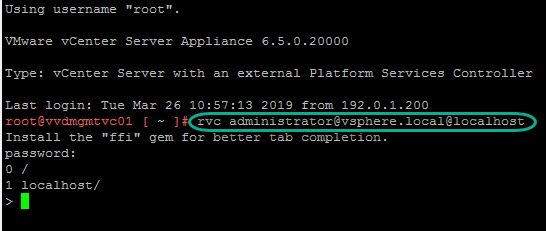
From within RVC you can simply use CD and LS in order to navigate to the required item, in this case we navigate to ‘computers’ (directory hosting the ESXi clusters). Begin by CD to localhost(vCenter), you can CD using the numeric values prefixing the items. We need to CD down into the ‘computers’ item which includes clusters, here are the commands used:
cd 1
/localhost> ls
0 vvdmgmtdc01 (datacenter)
/localhost> cd 0
/localhost/vvdmgmtdc01> ls
0 storage/
1 computers [host]/
2 networks [network]/
3 datastores [datastore]/
4 vms [vm]/
/localhost/vvdmgmtdc01> cd 1
/localhost/vvdmgmtdc01/computers> ls
0 vvdcl01-mgmt01 (cluster): cpu 253 GHz, memory 1880 GB
/localhost/vvdmgmtdc01/computers>
By using LS on the computers directory we can see that we have one ESXi cluster (0 vvdcl01-mgmt01), we can leverage the vsan.disks_stats to display disk capacity details for all disks associated with this cluster and their associated ESXi host. Using the ~0 with the cmd as this is the cluster numeric value (the only cluster in this example).
vsan.disks_stats ~0
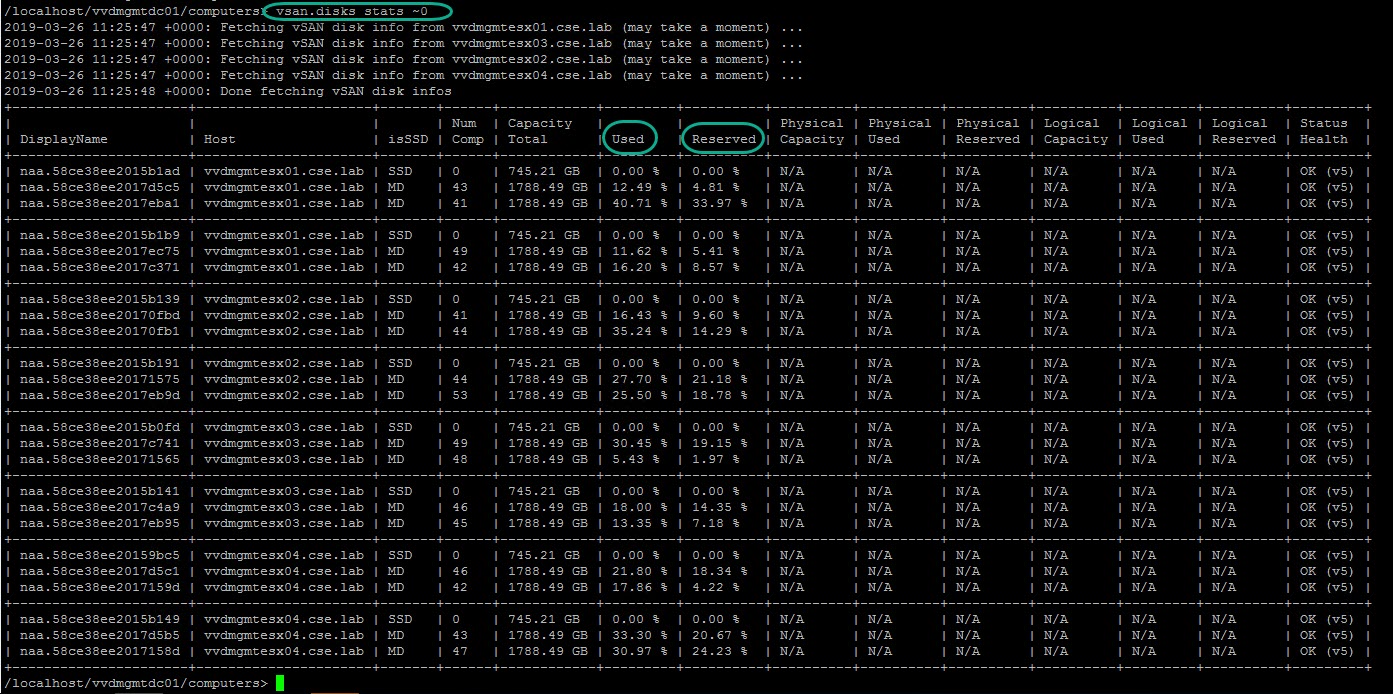
Reserved capacity indicates space used by thick objects, for example Virtual Machine Swap files are default as thick ( see previous post here on changing swap files to thin).

